Better PC cooling with Python and Grafana
I recently upgraded from a Ryzen 3700X to a 5950X. Double the cores, and nearly double the potential heat output. I didn’t upgrade my cooling solution, a 240mm Kraken X53 AIO liquid cooler.
Doing any real work with the 5950X made my PC significantly louder, and worse yet the fans were now spinning up and down suddenly and erratically.1
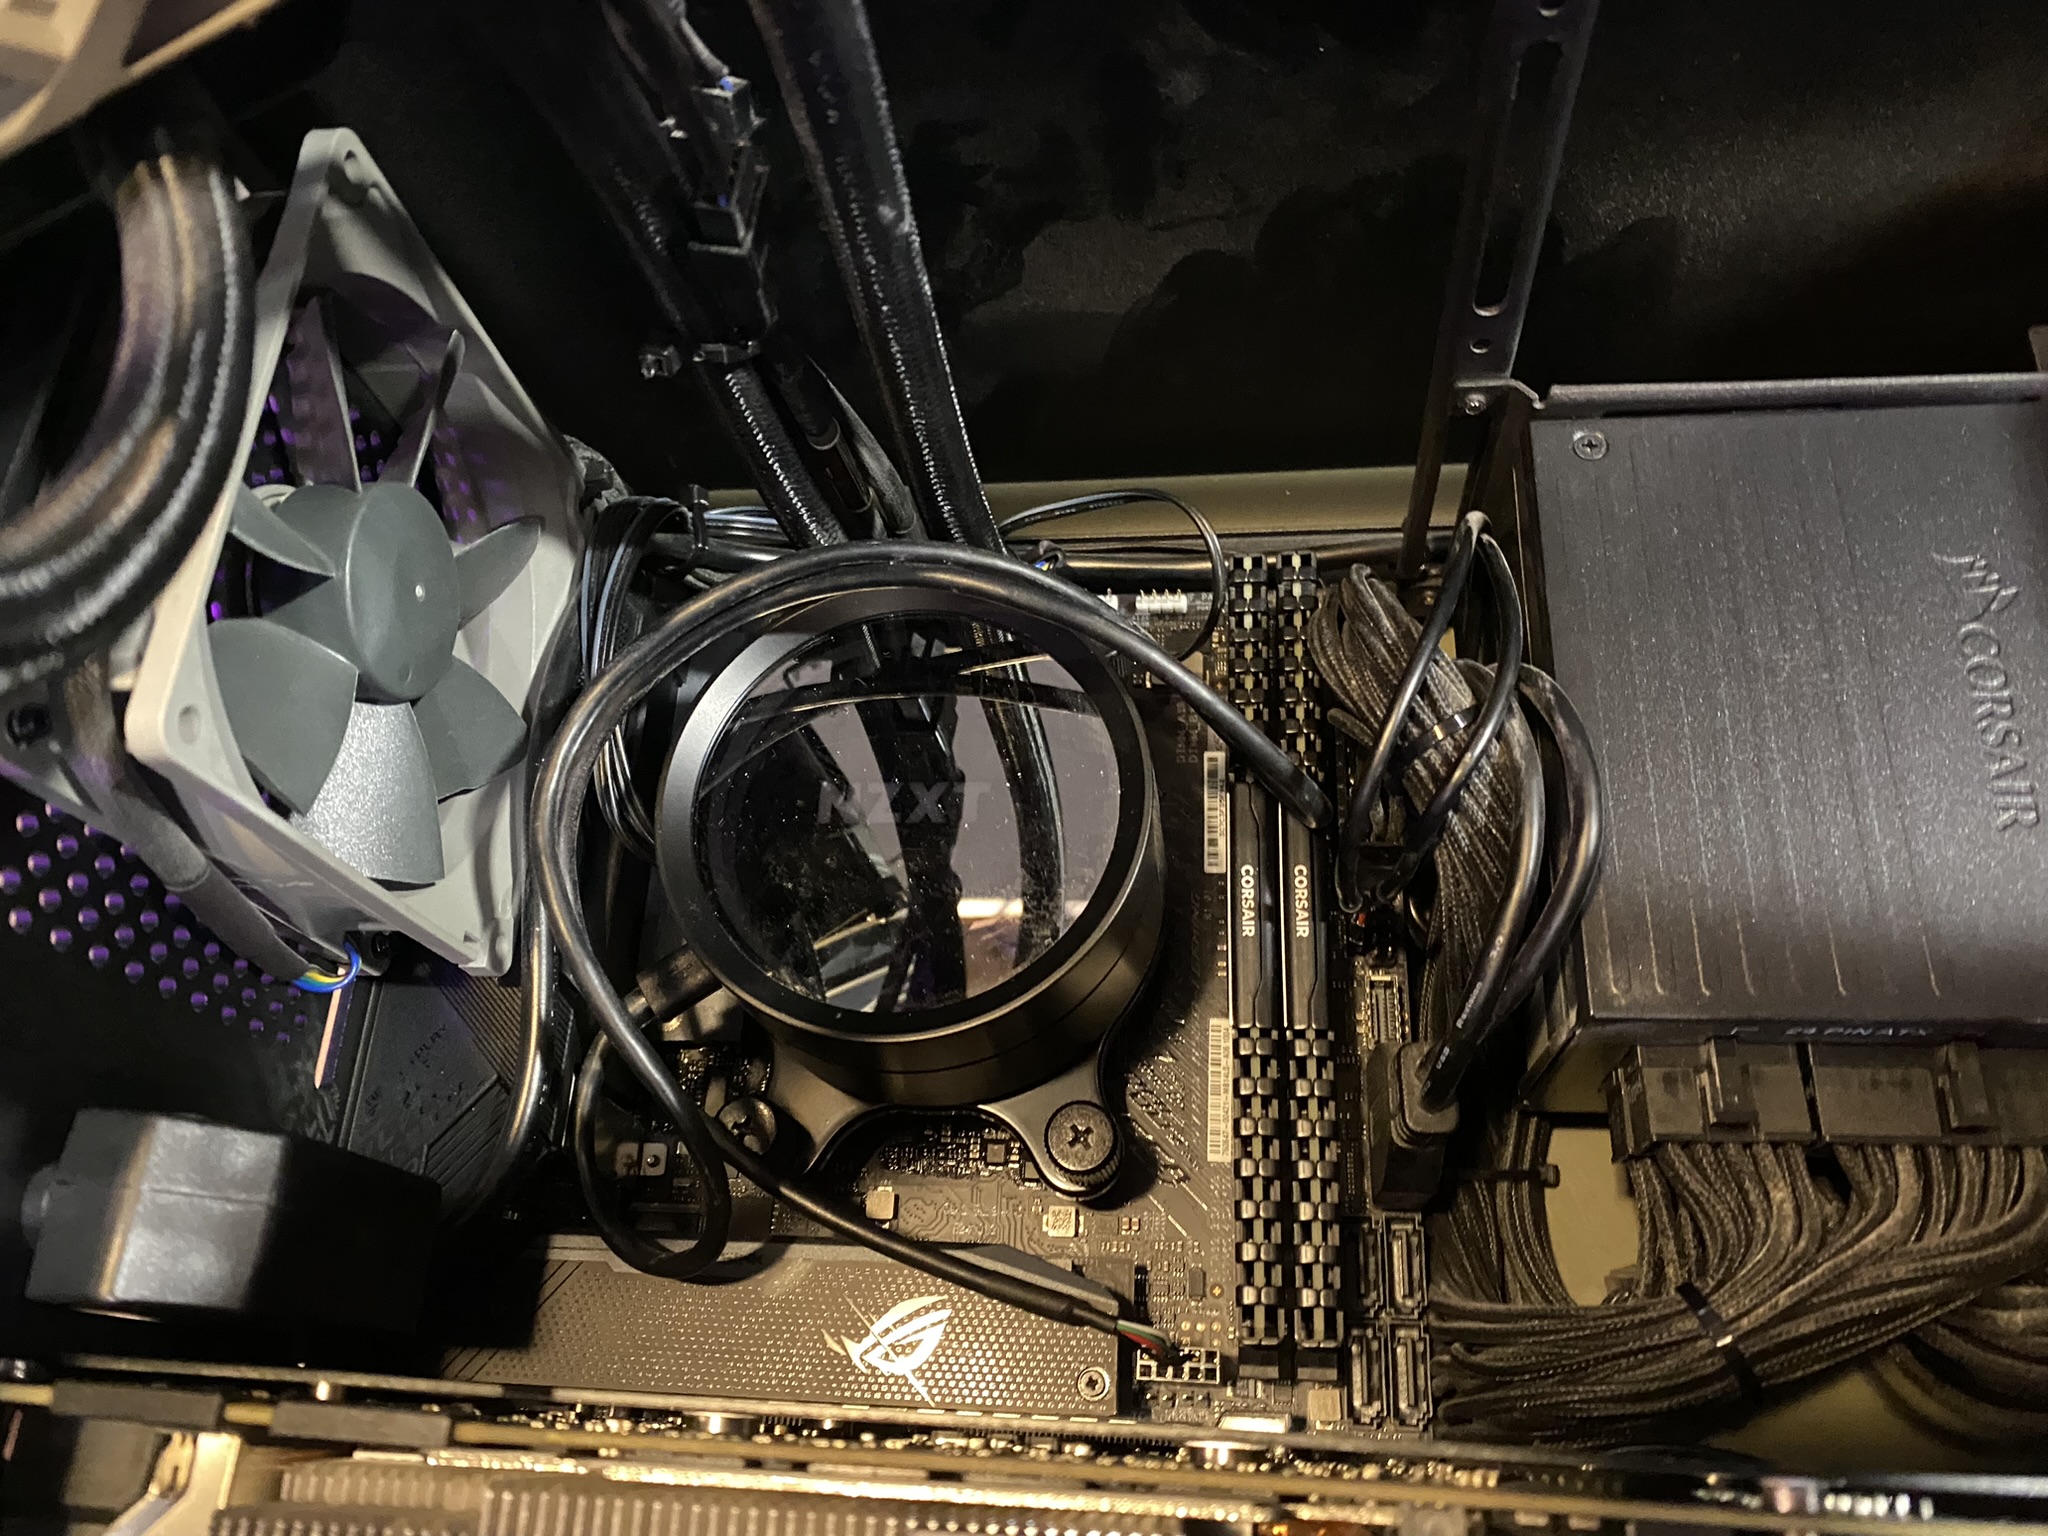
The reason for this is the radiator fans are controlled based on the CPU temperature, which quickly ramps up and down itself. This is the only option using the motherboard based fan control configurable in the UEFI for me – the X53 cannot control fans by itself.
I presume the quick temperature rises are specific to modern Ryzen CPUs, perhaps others too. Maybe this is due to more accurate sensors, or even a less-than-ideal thermal interface. Right now, I’m uncertain it’s not my thermal compound even.
I know modern CPUs – particularly Ryzen 5000/7000 or intel 13th/14th gen – are designed to boost as much as possible with tight margins around temperature and power limits.2
The kraken cooler is by default designed to vary the pump speed based on liquid temperature. I think this is not optimal for cooling – it does reduce the slight whine of the pump however.
The idea
As I use liquid cooling, there’s significant thermal mass available which really should mean the sudden ramping behaviour of the fans is not required.
If I could instead control the pump speed based on CPU temperature and the fan speed based on liquid temperature, I could take advantage of the thermal mass of the liquid to avoid ramping up the fans unnecessarily as the liquid takes some time to heat.
The CPU would also be cooled more effectively, and the rate of heat transfer to the liquid would peak with the CPU demand, instead of being tied to liquid temperature.
Goals
- Reduce irritating erratic fan speeds
- Reduce noise
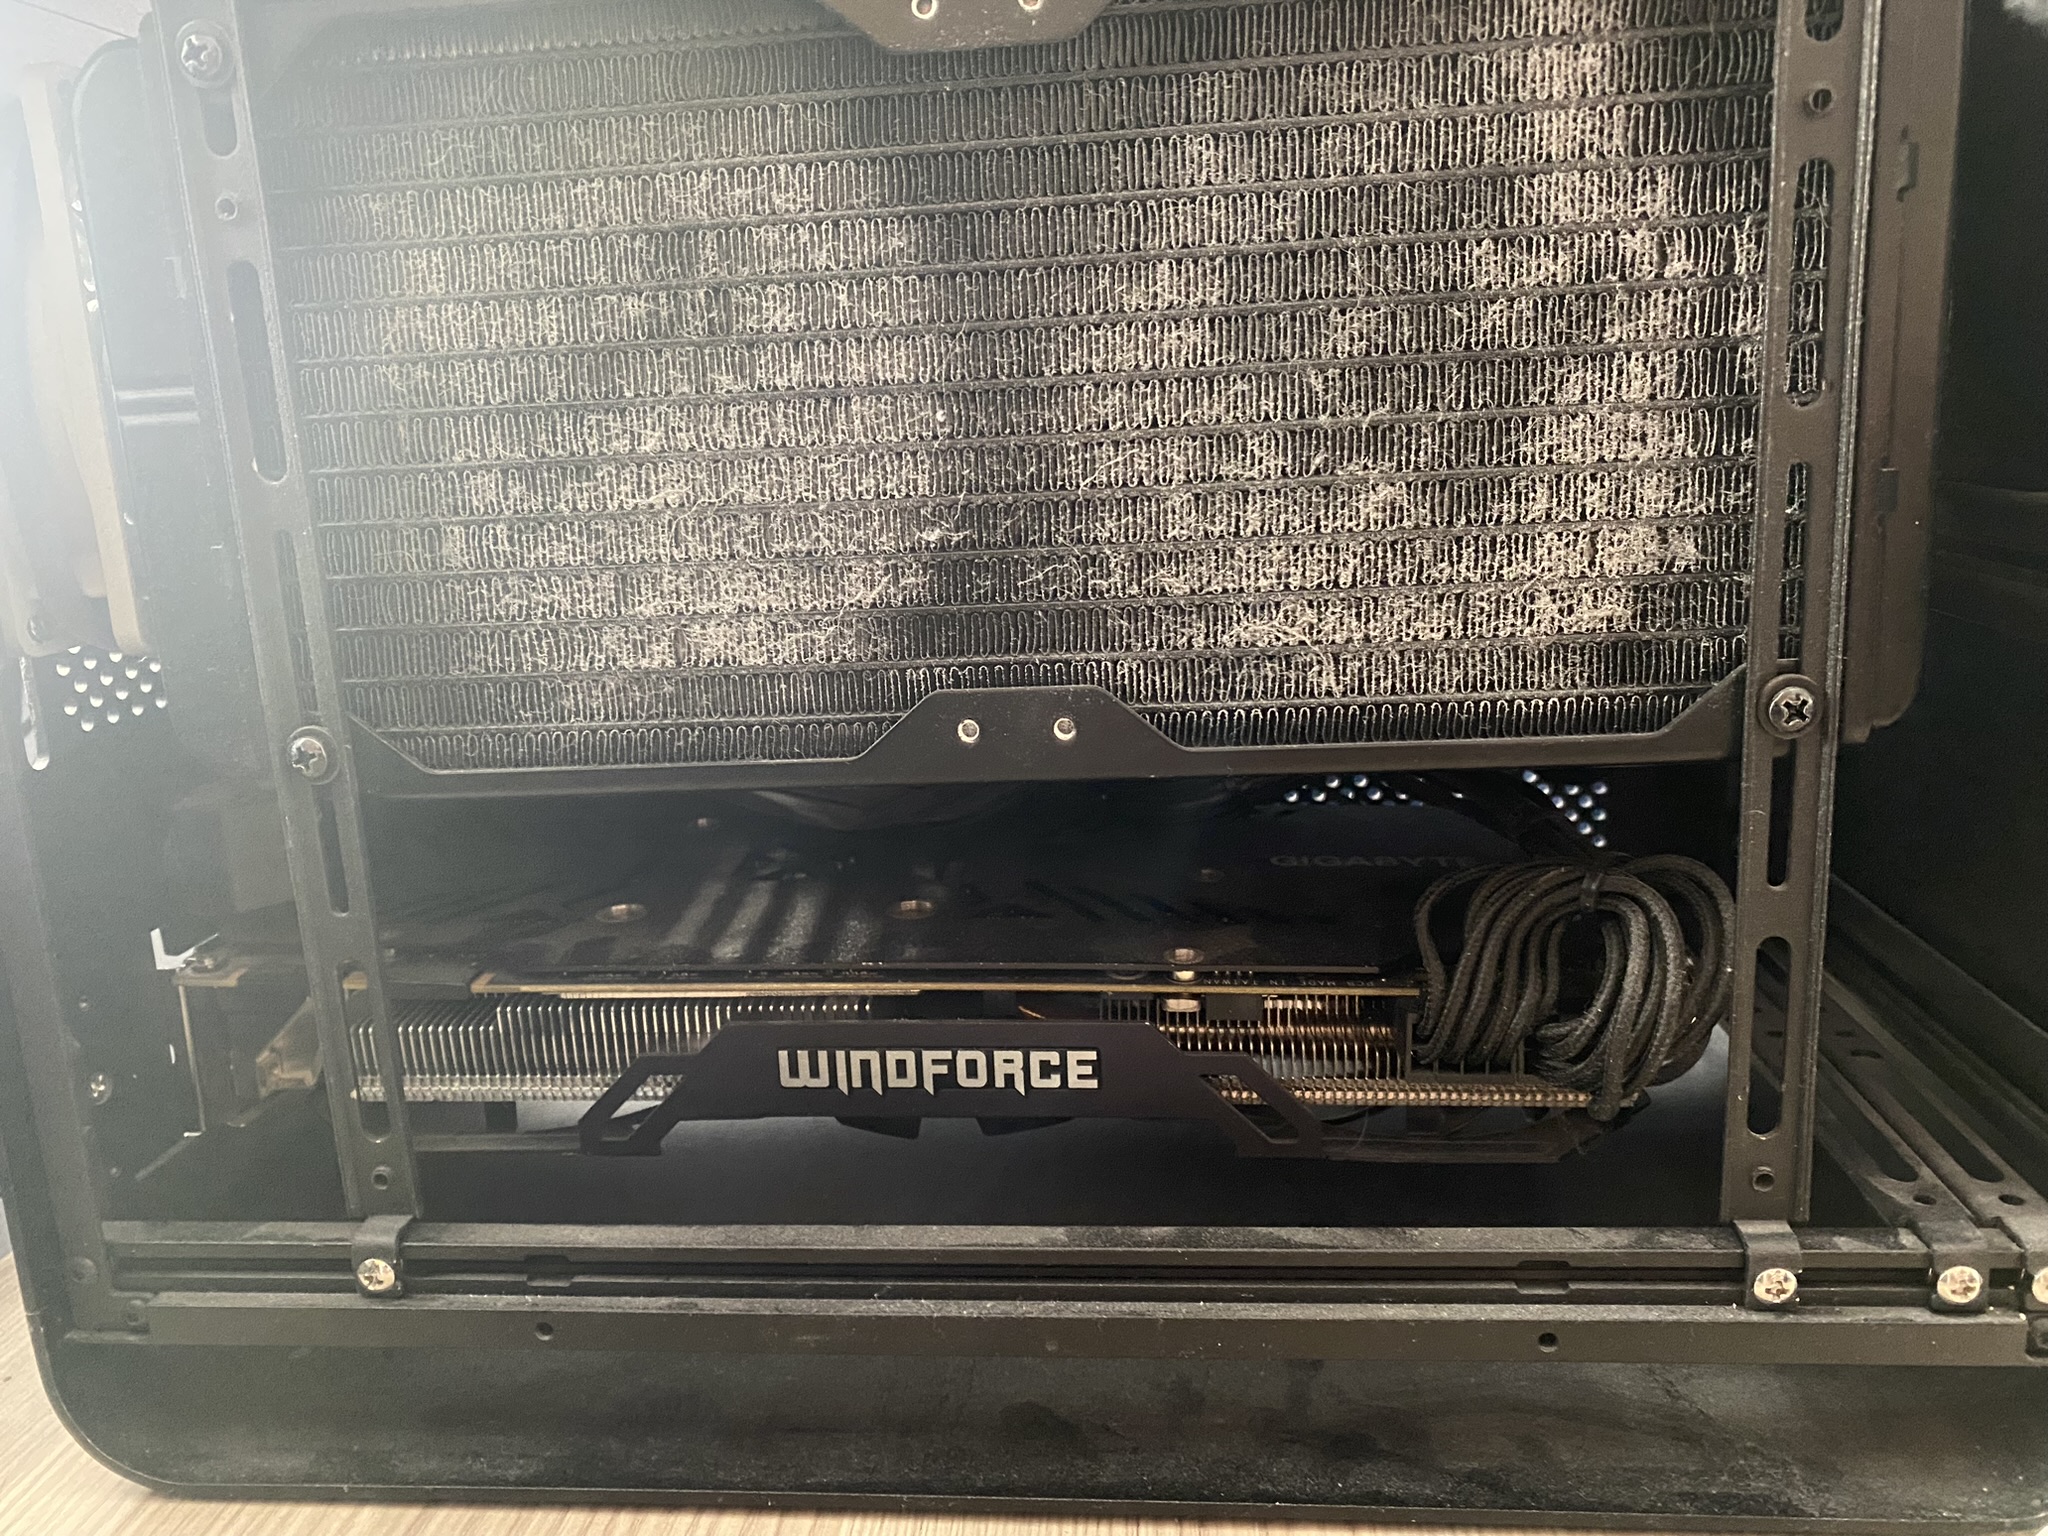
- Reduce dust
- Eliminate throttling if any
- Work on NixOS (my main OS)
Whilst I’m at it I may as well attempt a negative PBO2 offset to reduce the heat output of the CPU, and apply better thermal interface material in the hope to make cooling more effective. I could also try a traditional underclock/undervolt as described here.
Research
I decided to write a python script, installed as a systemd service to implement the idea. I’d need to read CPU temperature + liquid temperature, and control fan + pump speed.
Liquidctl
Liquidctl is an excellent project that allows programmatic control of the X53 among others. It even has python bindings! Writing the control loop in python therefore seemed like a good choice.
Liquidctl with the X53 allows reading & controlling pump speed as well as liquid temperature; unfortunately the X range of Krakens does not allow radiator fan speed control unlike the Z series. I had to find a way of controlling the radiator fans and also reading the CPU temperature.
For controlling the fans I considered making my own fan controller PCB, or using a Corsair Commander which I know can be interfaced under linux, also with liquidctl.
lm-sensors
In the mean time, I looked at lm-sensors has been around since the dawn of time. It is able to interrogate a plethora of hardware sensors by scanning various busses and integrating with many kernel modules. There are python bindings too.
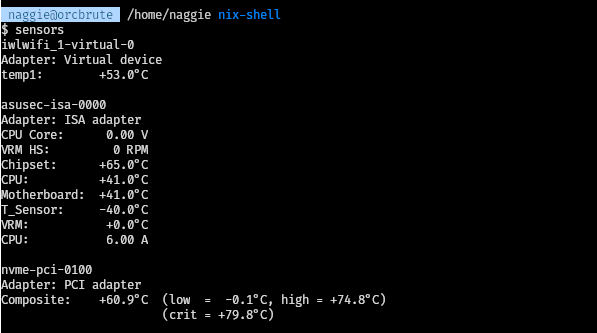
I experimented with parsing the output, and using the module. This worked fine – it was a little awkward due to the nested tree structure from lm-sensors – but nothing a flattening couldn’t fix.3 I didn’t like the extra complexity of the necessary sensors-detect scanning, nor the fact that I ended up calling the lm-sensors executable multiple times a second.
In the end I found a way of reading the temperature and controlling the fans connected to the motherboard using python after a friend suggested the possibility. This was thanks to the lm-sensors source code and scripts – I was able to find a fan control bash script that appeared to be interfacing with sysfs directly.
sysfs/hwmon
I figured I could do the same thing, and possibly read temperatures too! As it turns out, since lm-sensors 3.0.0 (2007) the kernel module drivers all implement the same sysfs interface and libsensors is an abstraction atop this to normalise manufacturer specific values.
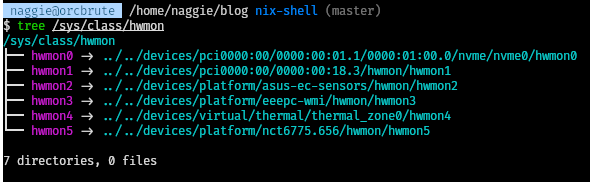
This sysfs interface is documented here. It’s straightforward! Just writing and reading values from specific files.
The kernel module I had to load after running sensors-detect was nct6775. This is for a family of system management chips, one of which exists on my motherboard. After loading this module, I could interface via sysfs – without libsensors or lm-sensors; this is great news as it means my script can be much simpler with one less dependency. nct6775-specific settings are documented here.4.
I’m also going to use k10temp to get the best reading of temperature from the CPU directly.
Here’s a quick summary on the files used to interface with fans and sensors with sysfs. Substitute hwmon5, pwm2 & temp1 (etc) for your own controller and channels.
/sys/class/hwmon/hwmon5/pwm2_enable– manual:1, auto:5/sys/class/hwmon/hwmon5/pwm2– value of PWM duty,0-255/sys/class/hwmon/hwmon1/temp1_input– temp in °C/sys/class/hwmon/hwmon1/temp1_name– name of temperature sensor/sys/class/hwmon/hwmon5/fan2_input– measured fan speed in RPM/sys/class/hwmon/hwmon5/name– name of controller
To find the right path for a given fan, you can look for clues via the given names and also figure out the mapping by writing values and watching the fans/sensors/temperatures change. Make sure you restore automatic mode after! Note that simply switching from automatic to manual is usually enough, as it will cause 100% duty and make it obvious what fan is connected.
The solution
You can download the complete script here. I’ll explain the meat of how it works in this section. Be warned – the script is specific to my system, but could be adapted.
Note having the control loop running on my OS could be risky – if the control loop crashes, the CPU could overheat or damage could otherwise be caused. Bear this in mind. That said, the CPU is designed to throttle so in practice it would be difficult to cause any damage.
I also rely on systemd to restart the python application if it crashes. Crashing is detectable by checking systemd and observing the calibration cycle – the fans ramp up.
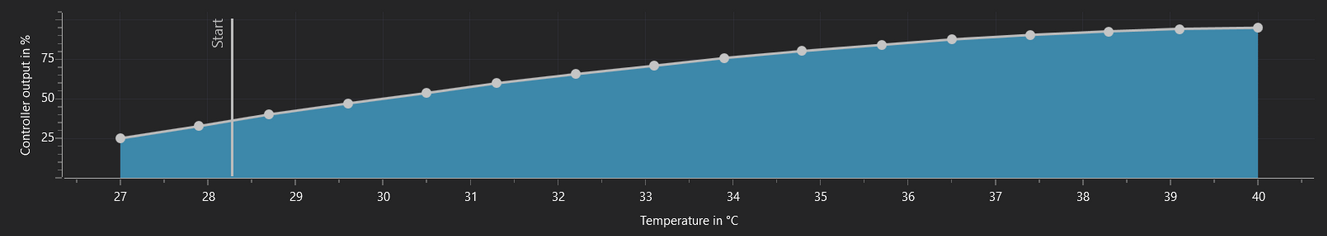
Calibration
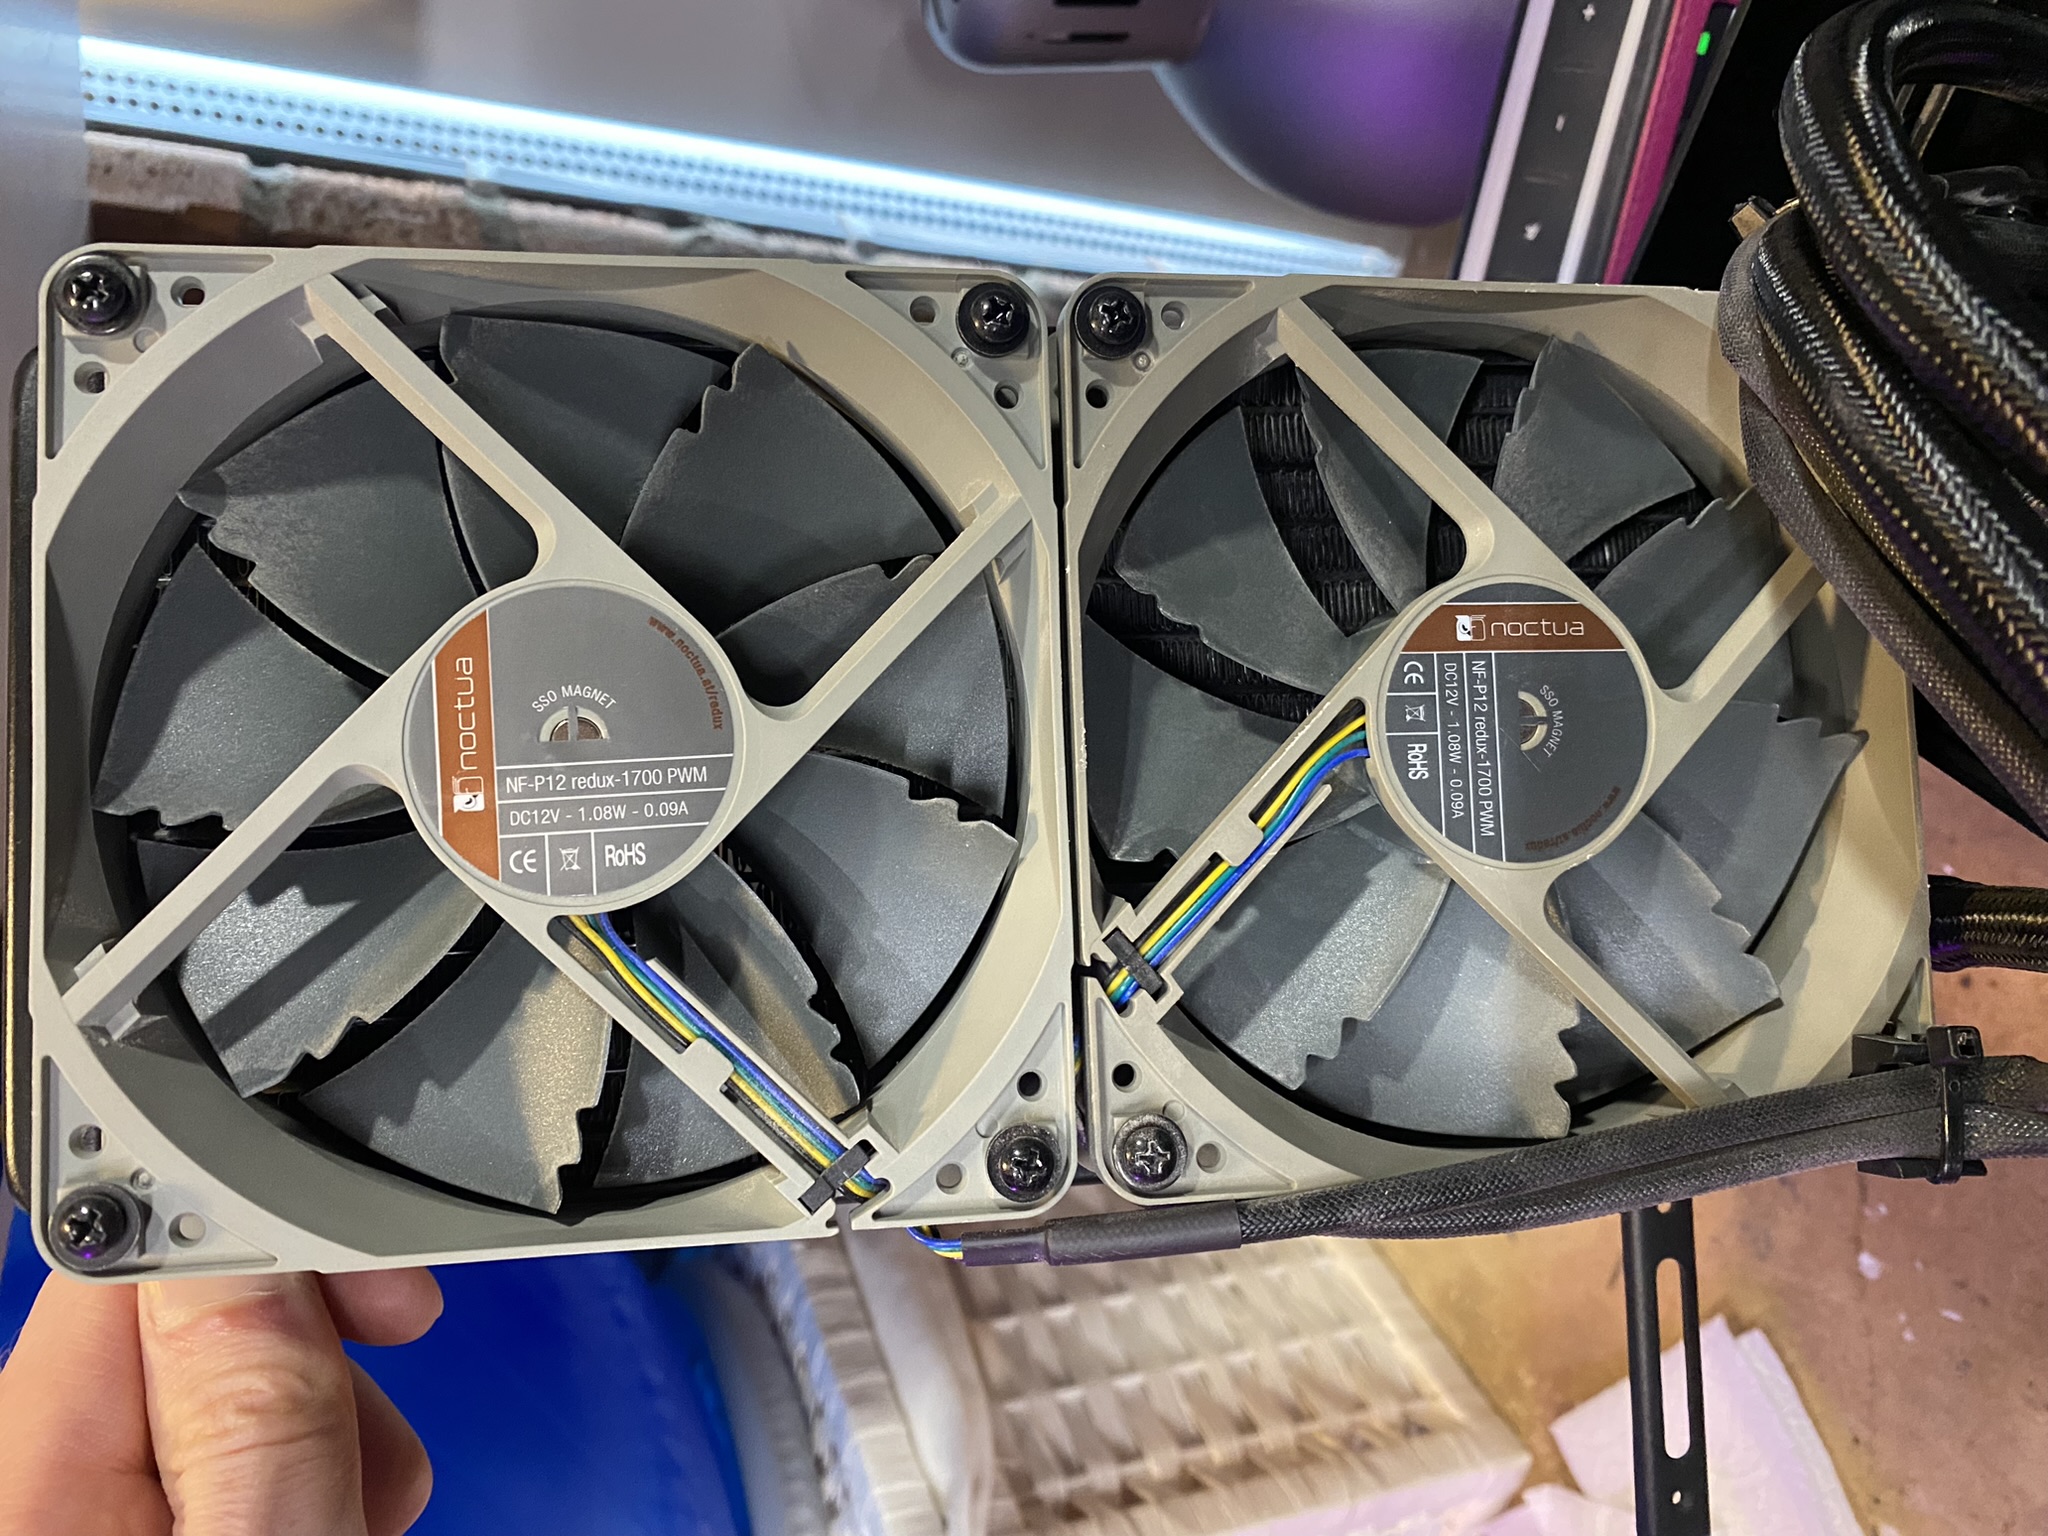
I use Noctua fans. According to the Noctua datasheets, Noctua guarantee the fans can run above a 20% duty cycle; below that is undefined. Usually, fans will run quite a bit below this before stopping – we should figure out what the minimum value is empirically on startup for the quietest experience possible.
| |
The minimum duty cycle is actually hysteretical – the fan will run at a lower speed than the start speed if already running due to momentum. To be safe, I prefer no start from 0% duty and increment slowly until the fan starts so it will always recover from a stall – as above.
I discovered the fans can start at around 11% duty, 200RPM – almost half the guaranteed duty and less than half the min speed – great! This means less noise and dust. This calibration is performed automatically at start.
I also measure the maximum RPM for curiosity on startup – by setting the duty to 100% and waiting.
The CPU temperature range is based on the maximum temperature defined by AMD, and a measured idle temperature at max cooling; spoiler: this worked fine, without any adjustment.
The liquid temperature was chosen ranging from idle temperature to max temperature, both on full cooling. This seemed to work well, too. For both, my room temperature was around 20c.
As for the case temperature, I took some values I considered reasonable.
The control loop
Most PC fan control software maps a temperature to a fan speed, using some kind of curve. For instance, 40-70c may correspond to 600-1500RPM. The hope is that, for a given heat output, the fan speed will settle at an equilibrium. This is done using the concept of simple negative feedback.
Some curves may rise quickly – presumably to anticipate a load, or gradually, to slow down the initial response of the system to perhaps ride out small peaks in demand. The peaks could cause annoying fluctuations in speed, otherwise.1

I know some BIOSes also allow a delay time constant to further smooth the response; basically a low pass filter simulating thermal mass!
I think the best solution is to have actual thermal mass – the liquid. This allows a smoother response without sacrificing cooling performance when it’s needed most. Especially important given how aggressively modern CPUs boost.
Anyway, the control loop reads 3 temperatures (liquid, case and CPU) then scales them linearly to 3 PWM duties – the pump, case fan and radiator fan. The PWM values are capped between the minimum PWM (detailed above) and 100%.
| |
This is done within a context manager to ensure we close the liquidctl device.
Installation
As I mentioned I’d be running the fan control software as a systemd service, I figured it was worth detailing how – on NixOS – here. All that’s required is to add this snippet to /etc/nixos/configuration.nix. Super convenient!
| |
I hope you like the name of the script.
Measuring performance with Grafana
Installation & setup
I could have dumped the values via CSV and plotted graphs in a spreadsheet. However for multiple readings this can become tedious. I gave Grafana, a monitoring solution combined with influxDB – a timeseries database. This is a common pairing.
I found 2 things non-intuitive when setting up this stack:
- Connecting the services together – terminology mismatch
- Influx-specific terminology around the data model
- Unhelpful error messages
…so I will cover setting the stack up and help make sense of it, as I presume someone else out there has faced similar difficulties. The “add data source” workflow and UI in Grafana looks polished, but in practice it does seem like a hack connecting the services together.
I used docker-compose to start influx and Grafana. Helpfully, you can initialise the database and set initial secrets as environment variables:
| |
After a docker compose up -d, you can log in to the Grafana instance at http://localhost:3000/ using admin/admin. After that you need to connect the Influx DB – do to Home > Connections > Data sources and click on InfluxDB after searching.5
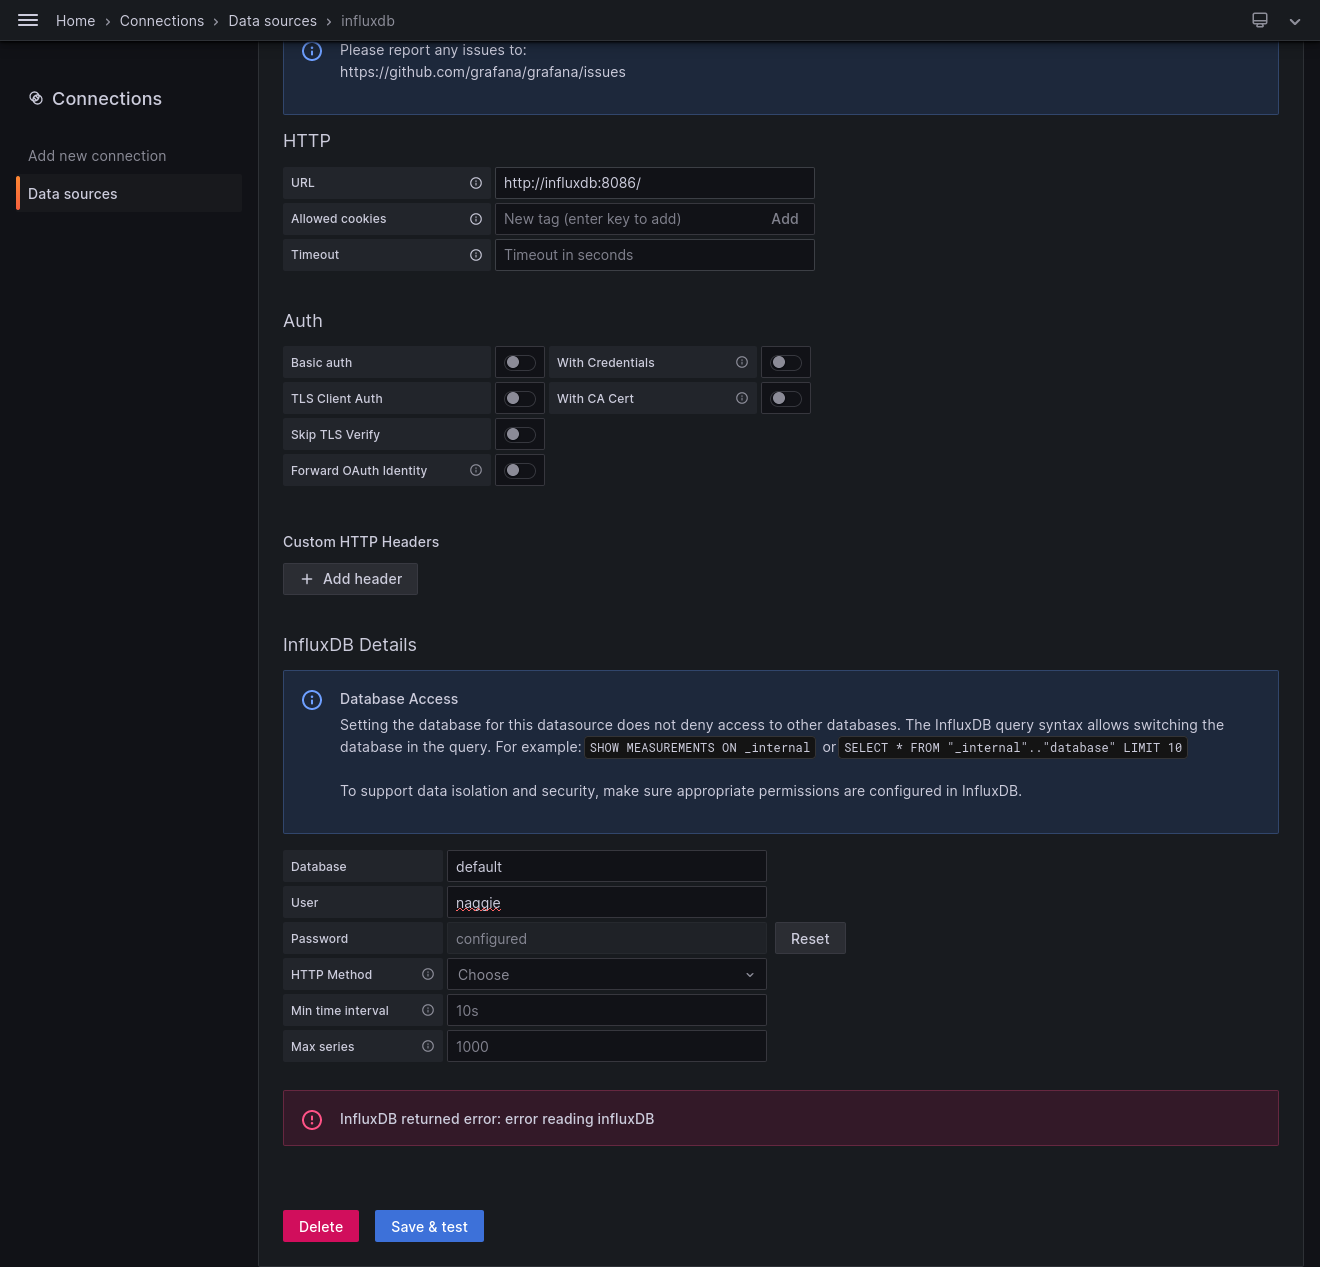
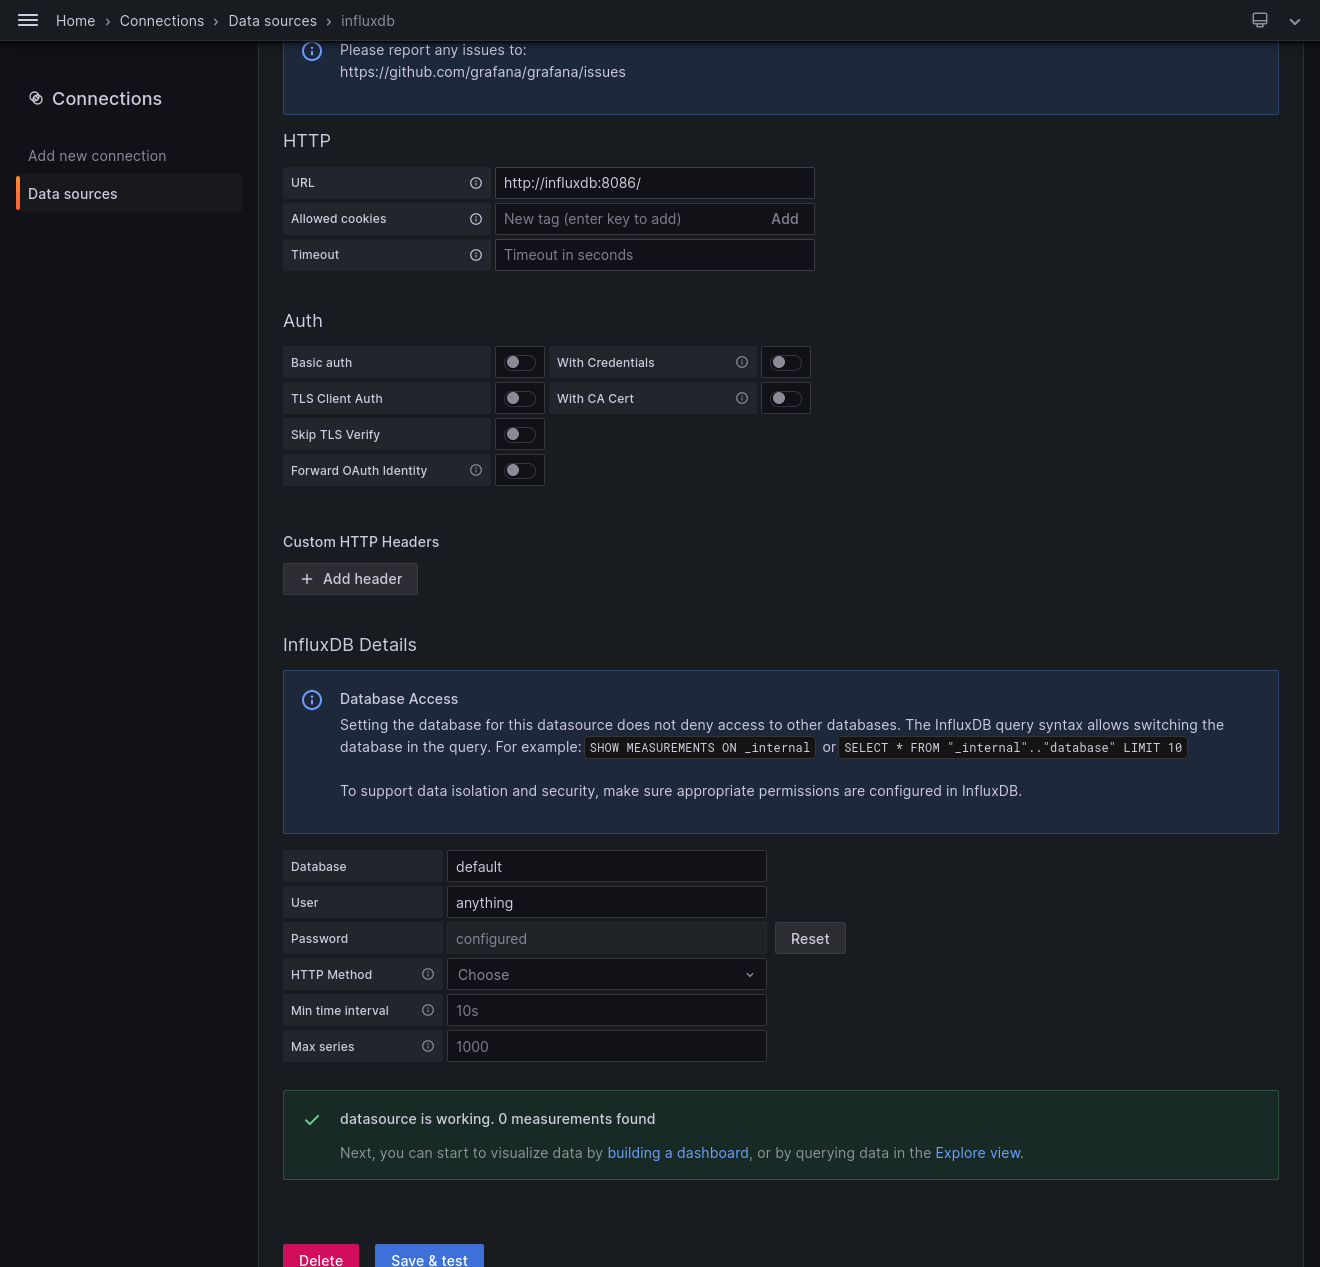
I set the URL to http://influxdb:8086/, and attempted to enter credentials. I didn’t see any option to add an API key (which seems like the logical thing to connect 2 services, and is defined in docker-compose.yml).
Here’s where things don’t make sense. I tried the username and password in the InfluxDB Details section, and also the Basic auth section to no avail. I was greeted with InfluxDB returned error: error reading influxDB. This error message doesn’t help, and the logs from Grafana/InfluxDB reveal nothing too.
In the end, after reading a random forum post somewhere, I learnt that the answer is to put the API key in the password section of InfluxDB Details. The User field can be any string.
FYI: The Database field actually means bucket in Influx terminology. Really, it feels like an abstraction layer that doesn’t quite fit.
Terminology
InfluxDB has its own volcabulary. I found it a bit confusing. After reading this thread, viewing this video and speaking to a friend I have this understanding when compared to a relational database:
tagsare for invariant metadata. They are like columns, and are indexedfieldsare for variable data. They are also like columns, but are not indexed- a
measurementis akin to a table - a
pointis equivalent to a row (but with no schema) - a
bucketis equivalent to a database
It seems to be good practice including multiple reading types in a single point, so long as the data is coherent. For instance, a weather station may report wind speed, temperature and humidity on the same data point if sampled together. As far as I can see, you could also report some reading separately with no penalty to reflect the sampling used. There is no schema (“NoSQL”).
Recording
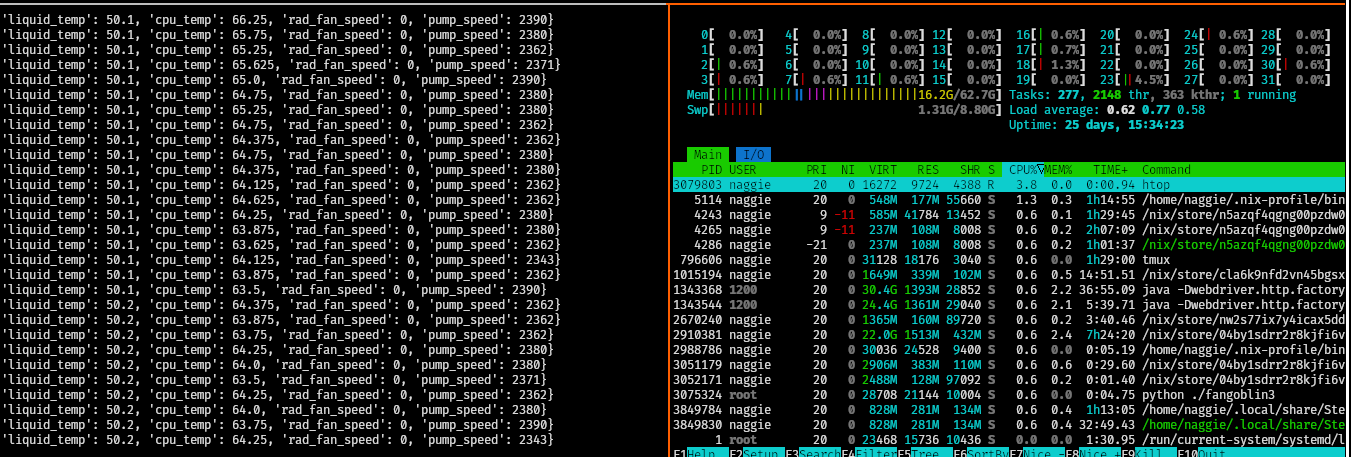
To record, I hacked together a monitoring system based on the fan controller script that would submit readings to InfluxDB. I made it independent so a failure wouldn’t affect the control loop. The script is here.
Results
Before the new controller, you can see the fan speed ramped up and down all over the place:
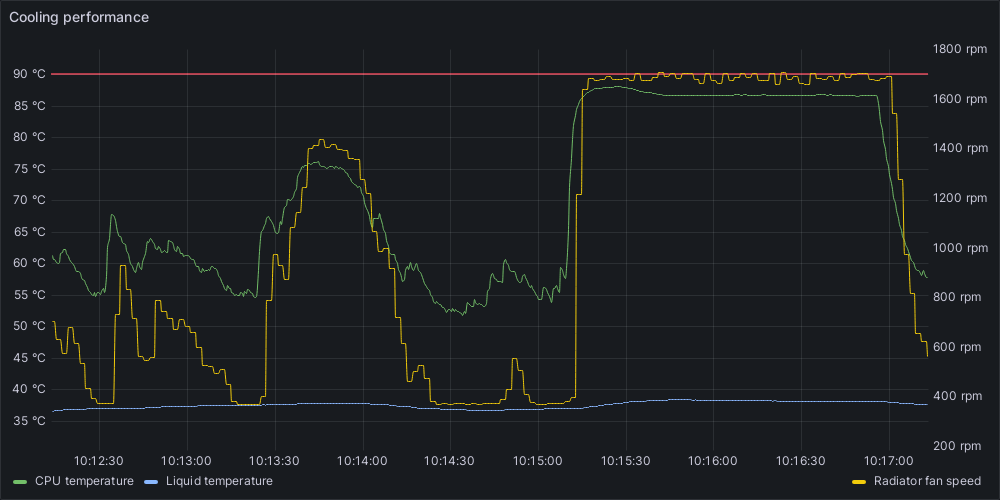
This was when building my blog (with a custom heavy optimiser) and then a stress test. Interestingly, you can see the CPU peak in temperature before setting down. The pump, set by liquid temperature by default, doesn’t spool up fast enough so the rate of cooling is less than it could be at the start – hence the peak.
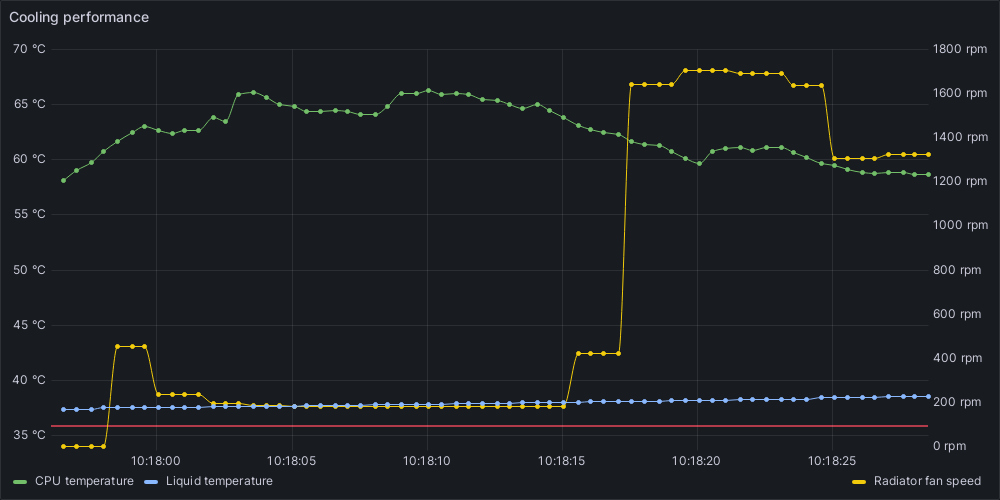
With the new control scheme, the fan speed change is much more gradual:
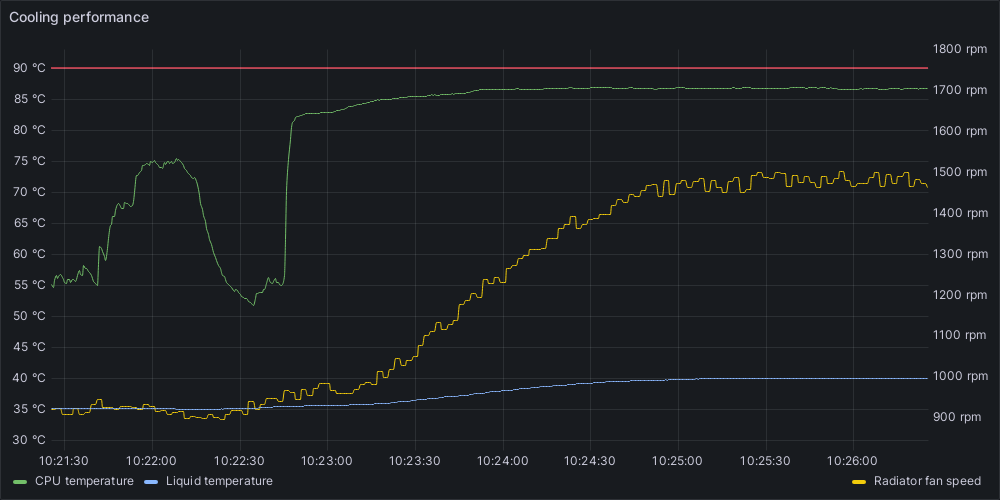
…and that peak in CPU temperature is gone! That’s because the rate of cooling maximises immediately as the pump spools up based on CPU temperature instead of liquid temperature. The time scale is the same for both graphs.
Here’s what I had before I started experimenting:
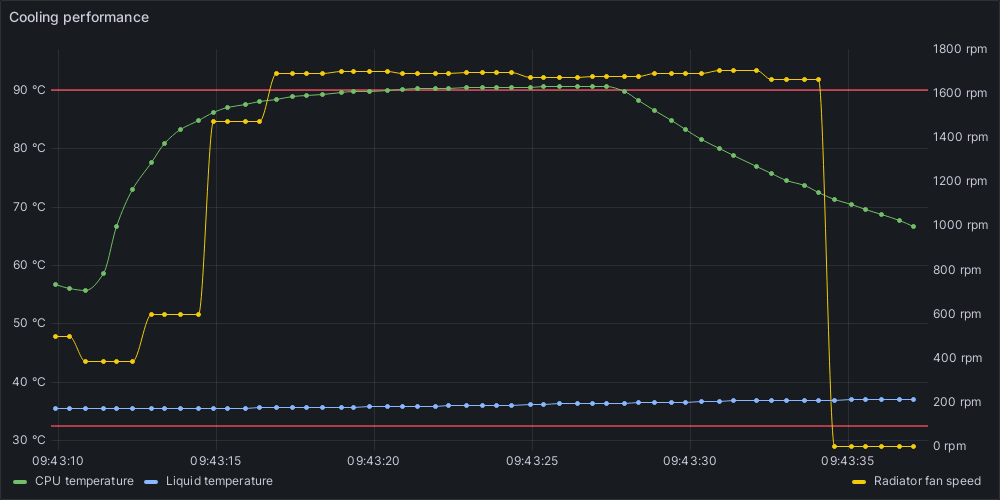
In this case the pump speed was fixed. The CPU was exceeding the maximum temperature and presumably throttling as a result.
Here’s a graph during calibration:
Here, the script finds the minimum speed and then the maximum speed. Interestingly, this max speed is not stable – perhaps there is a curve that the fan itself applies in its firmware.
Conclusion
Exploiting the thermal mass, and running the fans at an empirically derived minimum speed results in a significant improvement in cooling and acoustic performance.
Subjectively, the machine is now silent during idle, and doesn’t get audible unless the system is stressed for several minutes. The fans also don’t reach maximum when running games unlike before.
It is also possible to control the entire cooling stack without buying any additional control hardware, in my case.
My script above is, however, specific to my installation; so isn’t that useful outside of this post. As a result however, it’s trivial – I prefer this greatly over running a bloated GUI application.
Future improvements
Hybrid mode
I think a “hybrid” mode would be great. My PSU, a Corsair SF750 platinum, has a hybrid mode. In this mode (the default) the PSU operates passively (zero RPM fan) until some threshold when the fan kicks in. As a result it’s silent, but to me more importantly it’s completely spotless after 3 years in 24/7 use! No dust whatsoever.
I experimented with this by letting the system idle with the radiator fans off but the pump at 100%:
The liquid temperature quickly approaches the recommended maximum of 60c. This tells me it probably isn’t possible without a larger radiator. I intend to investigate more thoroughly though.
This also tells me that there’s a stark difference between cooling performance at minimum (silent!) fan speed and fans off. This could result in a hunting behaviour if the control algorithm isn’t right. The system would have to leave large gaps between the passive mode being activated to avoid sporadic system use resulting in toggling between maximum fan speed and zero.
In addition, we fill up the thermal mass in the process, meaning the CPU is likely to overheat immediately if loaded in this mode before the fans kick in and the liquid temperature drop. A solution to this may be to detect if the computer is in use (mouse movements) and only allow passive mode if not. The fans would start and bring down the liquid temperature as soon as the machine is used.
Abstraction
Making the script useful for other machines could involve abstracting coolers and sensors. The control loop for each pair could also be in a separate thread to prevent a crash in one causing the others to stop too.
Integrated monitoring
The script could record straight to InfluxDB. This could be useful for long term analysis and assessing the impact of changing system properties – a new thermal interface compound, new fans etc.
Stall speed detection
I mentioned earlier that the start speed of a given fan is greater than the stall speed. Providing there’s a start/restart mechanism, it should be possible to run the fans even slower, resulting in even less noise and dust.
Beat frequencies
The fans (2x radiator, 1x case) sometimes make a throbbing noise. This is due to a beat frequency being emitted when the fans are close in speed.
It’s slightly annoying. The system could drift intentionally to allow a large enough gap in rotational speed to avoid this.
General undervolting
I’ve played with PBO2 adjustment as I said, but it should be possible to reduce the voltage at the expense of a bit of performance.
Better fans and thermal interface compound
Finally, courtesy of a friend I have a pair of Phanteks T30s to try. Also, I have some Noctua NT-H1. They could help!
Fluctuations are more annoying than louder fans, in my opinion. ↩︎ ↩︎
Likely because they have many accurate on-die sensors, with algorithms that react quickly to control power consumption before risking damage. ↩︎
See, interview code challenges are relevant and useful in the real world! ↩︎
I have the luxury of having to support only one computer. No need to generalise this for other machines – though it’s easy to adapt for your purposes. ↩︎
There are many integrations, cool! ↩︎
Thanks for reading! If you have comments or like this article, please post or upvote it on Hacker news, Twitter, Hackaday, Lobste.rs, Reddit and/or LinkedIn.
Please email me with any corrections or feedback.